Fibonacci trading strategy—retracements
Who is Fibonacci? Introduction of the ‘Liber Abaci’
How is Fibonacci relevant to financial markets?
How to use Fibonacci retracements in trading
Drawing Forex Fibonacci retracements in MT4
Fibonacci retracement strategy for Forex trading
Benefits of the Fibonacci retracement strategy
Who is Fibonacci? Introduction of the ‘Liber Abaci’
Born in Pisa around 1170, Leonardo Pisano is better known by his nickname Fibonacci. He was educated in North Africa, travelled widely and studied different numerical systems and methods of calculation. At that time the Roman numeral system was most popular, but Fibonacci recognised the enormous advantages of the mathematical systems used in the countries he visited. He started working on the new system and presented it in his famous book 'Liber Abaci' in 1202. He introduced the modus Indorum (method of the Indians), today known as the Hindu-Arabic numeral system.
Fibonacci’s work made a profound impact on European thought because performing arithmetical operations with Arabic numerals was far quicker and more efficient than with the old Roman system. The book was widely copied and drew the attention of the Holy Roman Emperor Frederick II, who granted Fibonacci a salary in recognition of his services.
The book comprises three sections, the first covering numbering from 0 to 9 and positional notation. Fibonacci demonstrated the practical use of the numeral system by applying it to commercial bookkeeping, interest calculation, money changing, and similar topics. The second section deals with a range of issues faced by merchants, such as goods pricing, profit calculation, and currency conversion. The author is most famous for the Fibonacci numbers and the Fibonacci sequence, which are introduced in the third section.
The Fibonacci sequence is a series of numbers where each number is equivalent to the sum of the two numbers previous to it: 0, 1, 1, 2, 3, 5, 8, 13, 21, 34, 55, 89, 144 and so on to infinity.
This sequence ties directly into the 'golden ratio' because if you take any two successive Fibonacci numbers, their ratio is very close to 1.618. Therefore, this figure, 1.618, is called 'phi' or the golden ratio.
The golden ratio appears frequently in nature, architecture, fine arts, biology, and even the financial markets like Forex. Examples of where the golden ratio occurs include the Great Pyramid of Giza, Leonardo da Vinci's Mona Lisa, nautilus seashells, spiral galaxies, sunflowers, tree branches, beehives, and human faces.
How is Fibonacci relevant to financial markets?
You will commonly see the 61.8%, 38.2%, and 23.6% Fibonacci levels used in the Forex and other financial markets. These numbers are not directly from the sequence, rather, they are derived from mathematical relationships between the numbers in the sequence.
- The basis of the 61.8% ratio is derived by dividing a number in the Fibonacci series by the number that follows it. For example, 34/55 = 0.6181.
- The 38.2% ratio is obtained by dividing a number in the Fibonacci series by the number two places to the right. For example, 34/89 = 0.3820.
- The 23.6% ratio is calculated by dividing a number in the Fibonacci series by the number three places to the right. For example, 34/144 = 0.2361.
How to use Fibonacci retracements in trading
Creating Fibonacci levels has become much easier thanks to modern trading programs. Even beginners can easily select this tool on the chart, determine the asset's lowest value, and then move to the peak value.
In addition, you can find the necessary Fibonacci levels simply by dividing the distance between two entry points: the maximum and the minimum. Horizontal lines are formed at the 61.8%, 38.2%, and 23.6% levels. Sometimes, traders also take into account the 50% level, even if it is not derived from Fibonacci.
The technical tool is quite universal in use. It can help you identify potential reversal or correction points within a trend. In a downtrend, the Fibonacci trading strategy will help you determine the best moment to open a short position. In an uptrend, the tool will show the entry points and the ideal moments to buy during corrections.
However, there is no point in using Fibonacci levels on sideways trends since they work only on pronounced trends.
As with any technical analysis tool, it is best to use them in combination so that the results are most accurate:
- Fibonacci retracement levels combined with moving averages indicate a more likely reversal point. Traders often combine the 50% level and the 50-day moving average.
- Resistance and support levels also significantly increase the validity of Fibonacci retracement levels.
- If a candlestick pattern forms near the levels, it further confirms a trend reversal.
It is also worth considering that the Fibonacci trading strategy may work differently across different timeframes. This can confuse novice market participants. Therefore, it is better to study the tool on a daily or four-hour timeframe and only then move to shorter timeframes.
Drawing Forex Fibonacci retracements in MT4
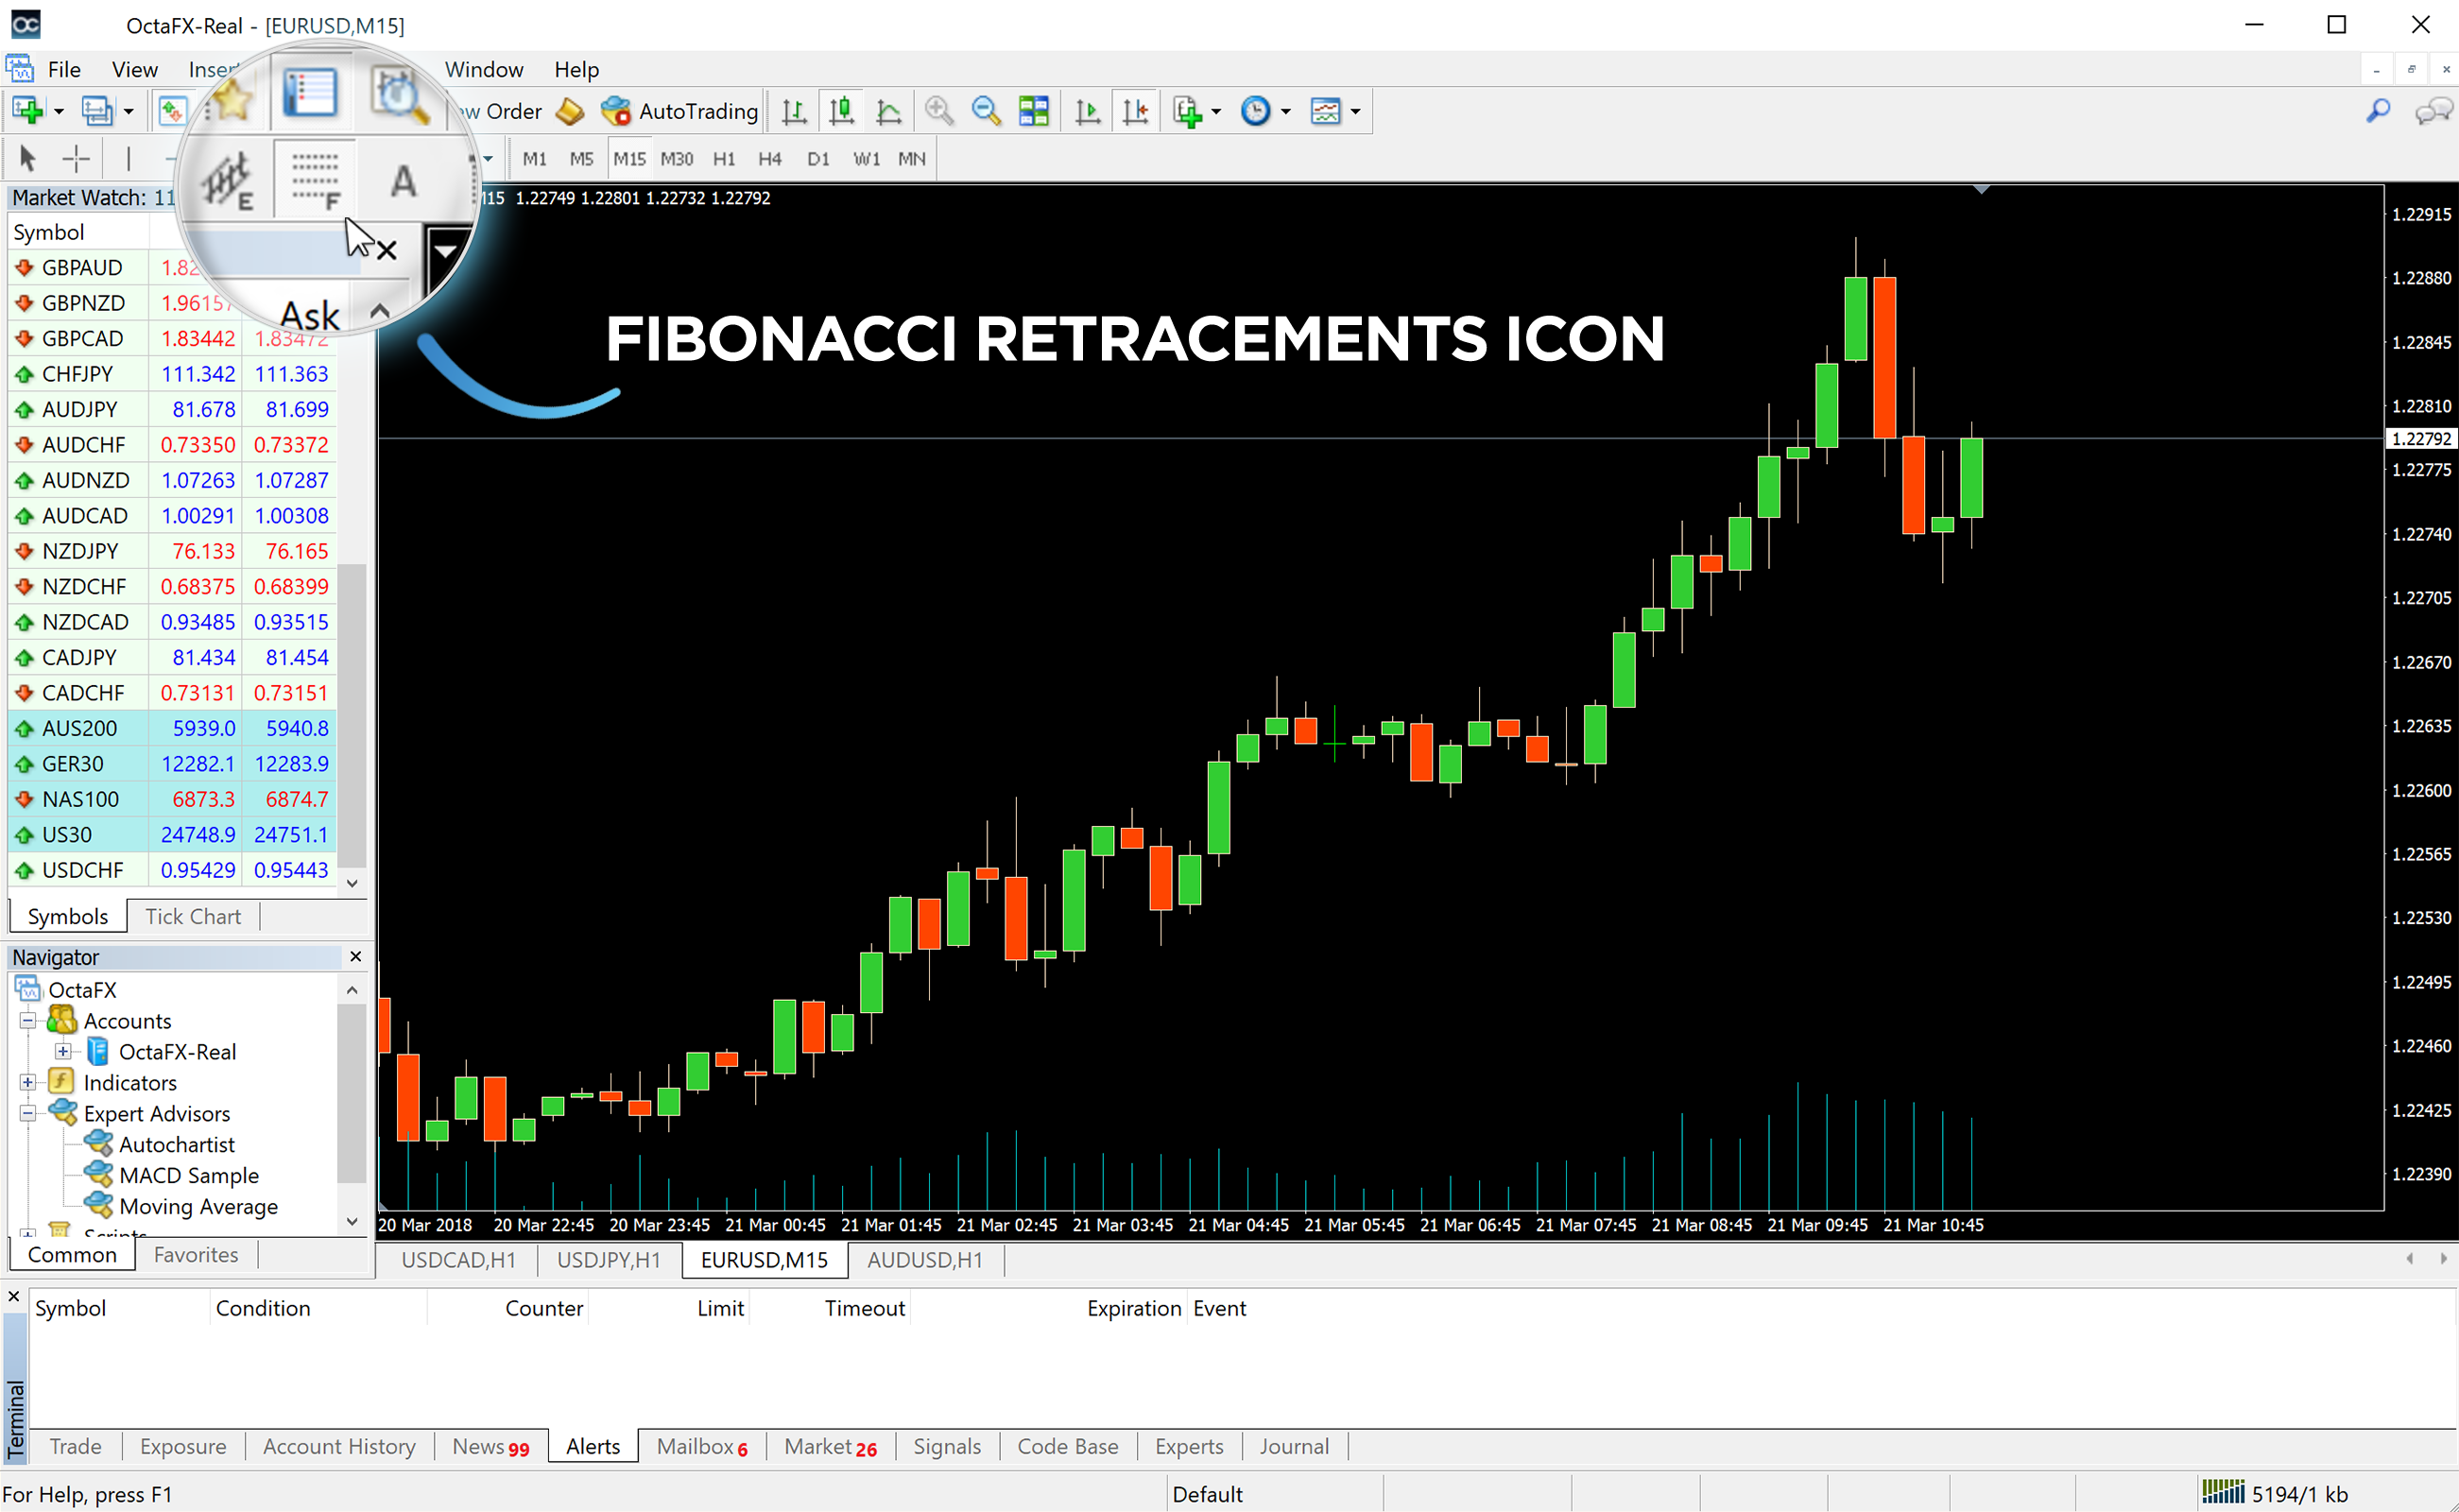
To draw Fibonacci retracements, click on the Fibonacci retracements icon in the toolbar at the top left of the screen.

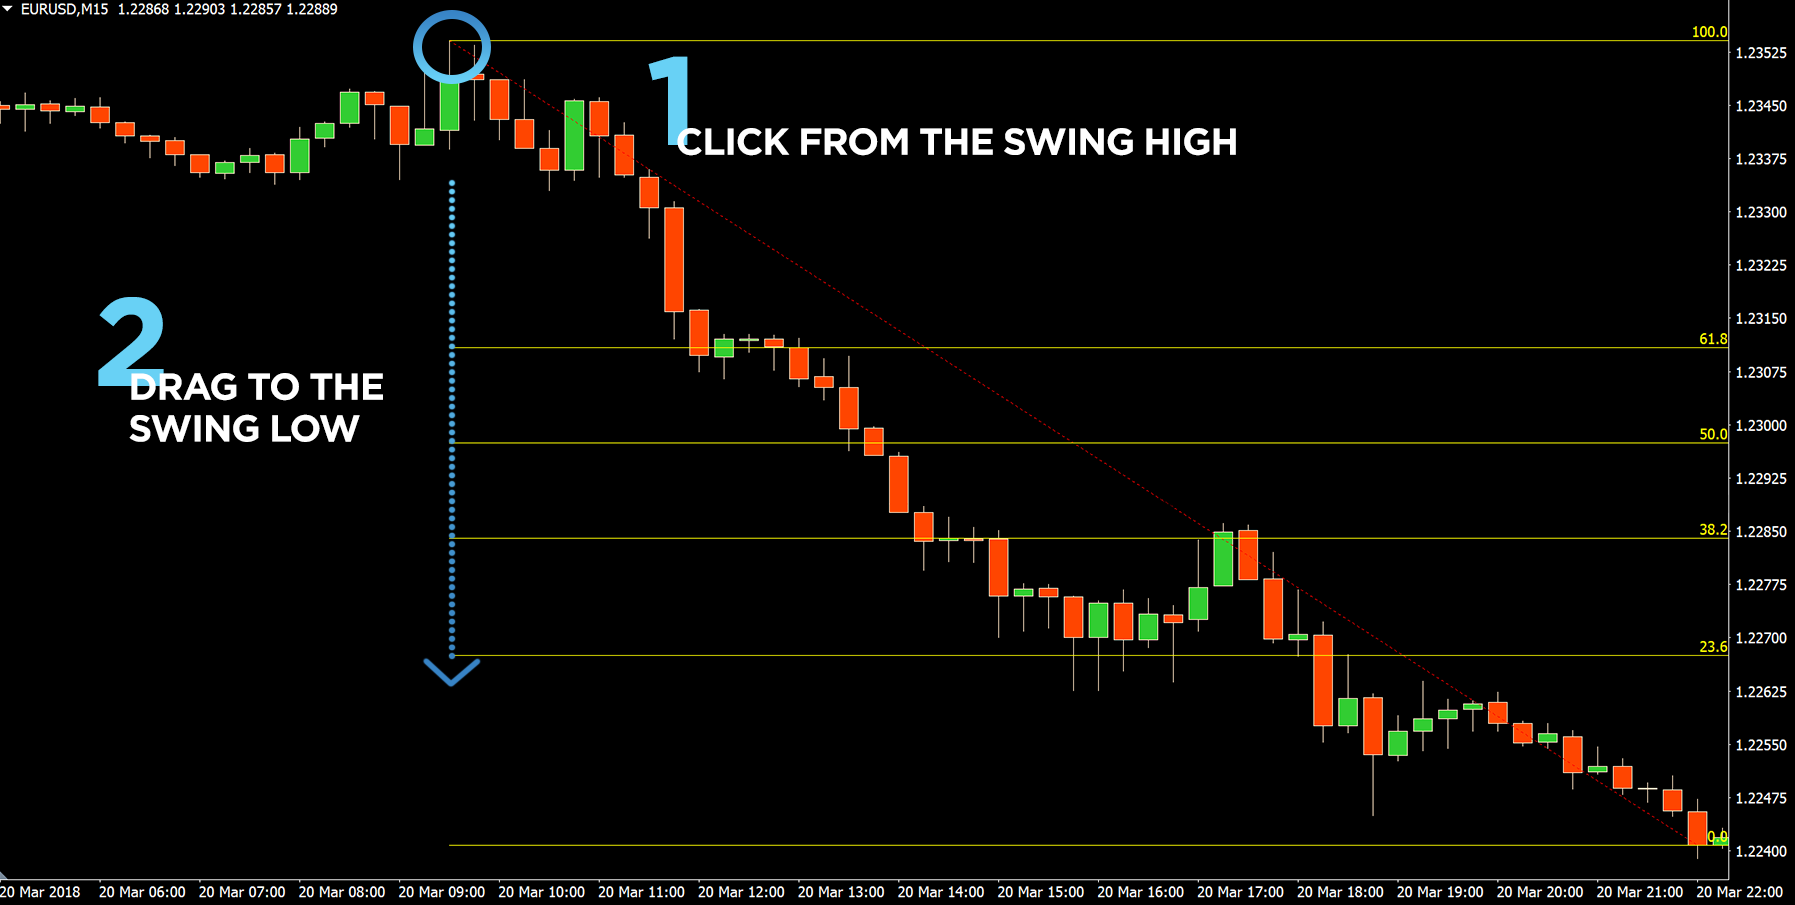
- In the case of a down move, double-click from the swing high (the highest recent high) and drag to the swing low (the lowest recent low). From there, you will see a grid of 23.6%, 38.2%, 50%, and 61.8% levels on the chart. These levels represent potential resistance points, where the price might bounce and reverse to a lower level.

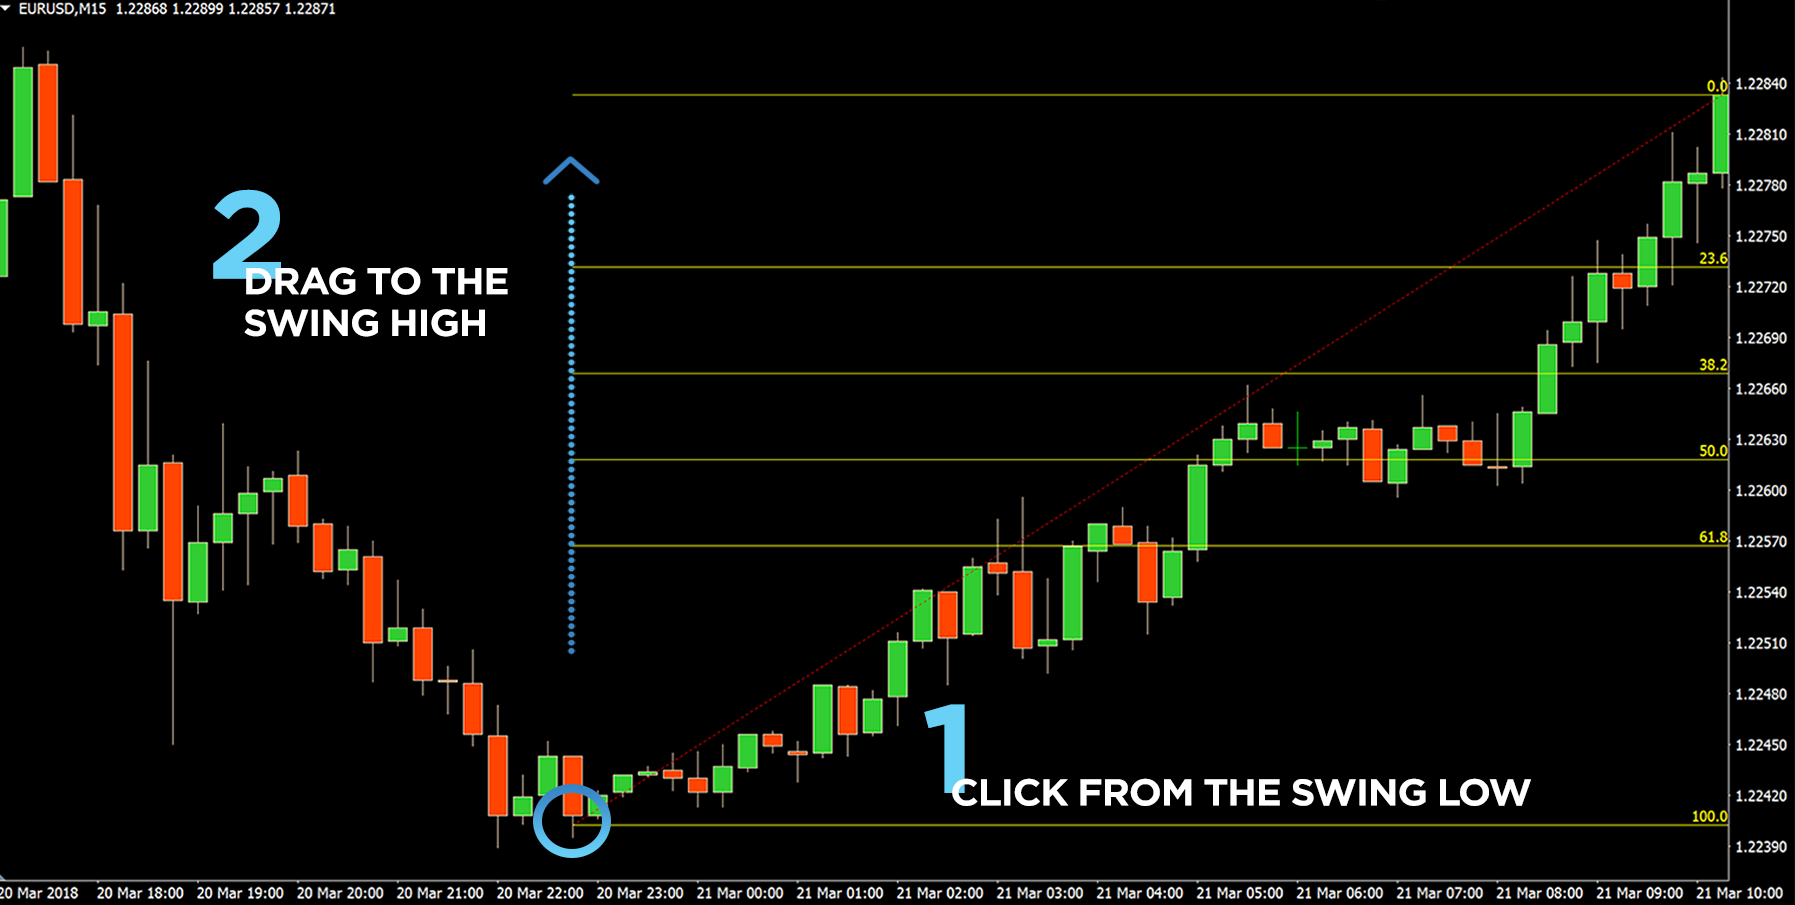
- In the case of an up move, double-click on the swing low and drag to the swing high. From there, you will see a grid of 23.6%, 38.2%, 50%, and 61.8% levels on the chart. These levels represent potential support points—where the price might bounce and reverse higher.

Fibonacci retracement strategy for Forex trading

Forex Fibonacci retracement levels are depicted by using the high and low points on a chart and marking the key Fibonacci ratios of 23.6%, 38.2%, 50%, and 61.8% horizontally in a grid. These horizontal lines represent potential reversal levels. Fibonacci retracements help determine where to place orders for market entry, take profits, and set stop-loss orders. They can also pinpoint key levels of support and resistance.
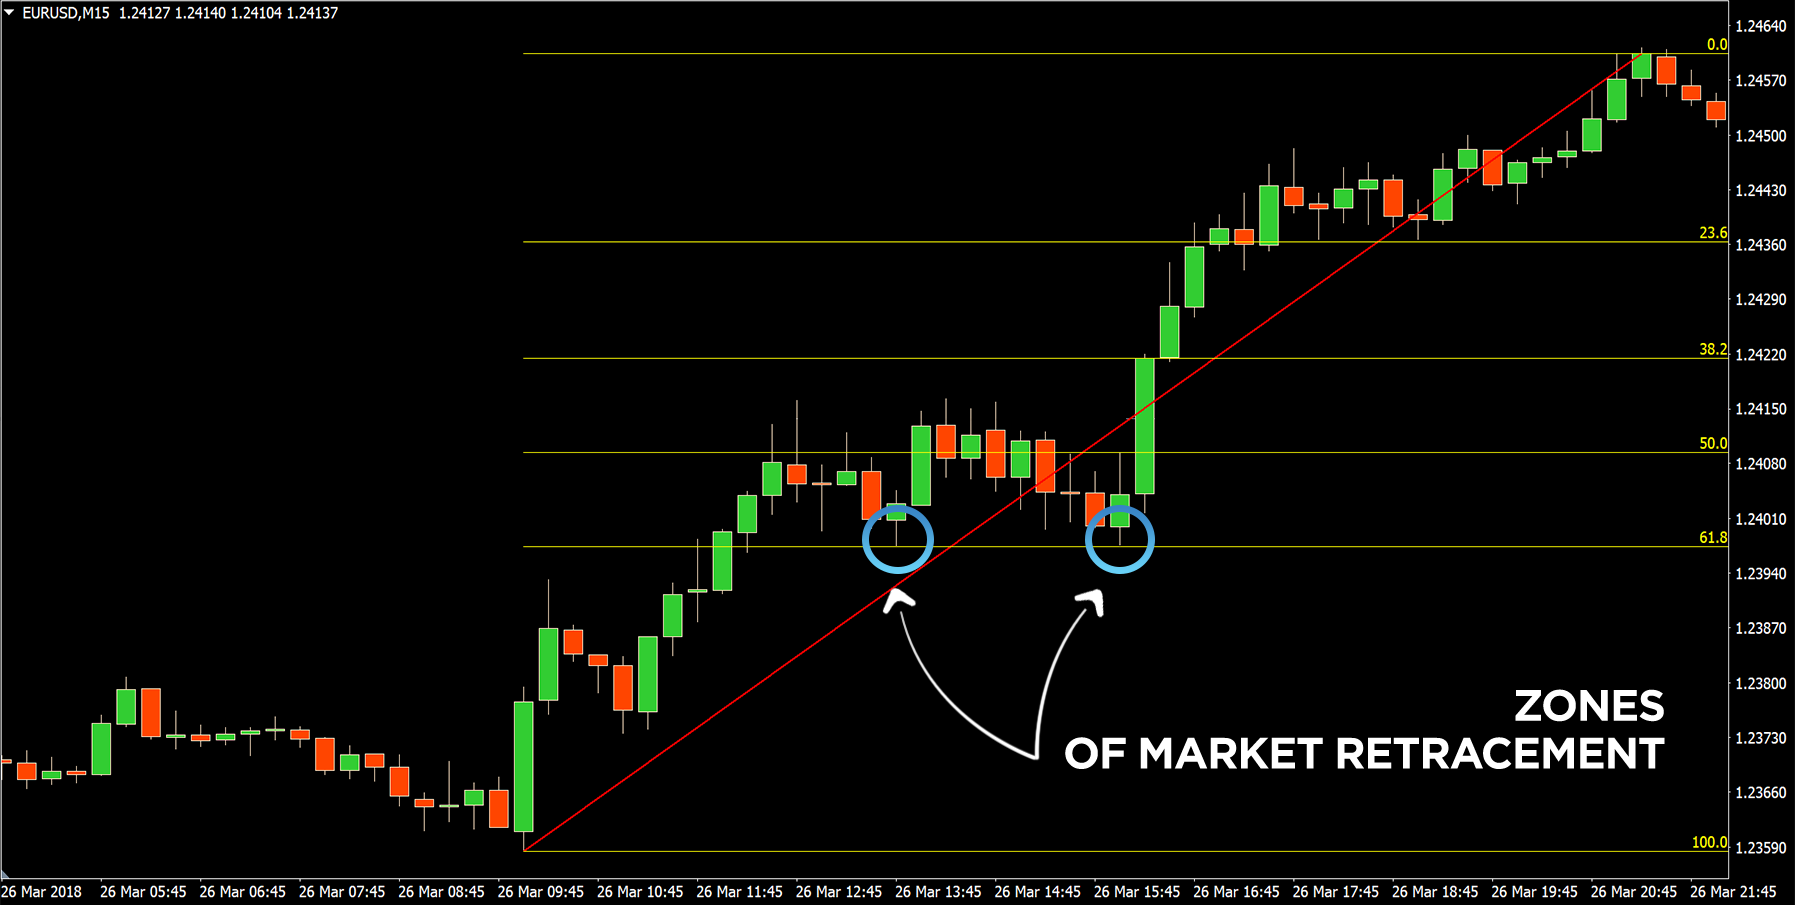
Retracements are usually calculated after the market has moved significantly, either up or down and has flattened out at a particular price level. The most popular Fibonacci retracements levels are 61.8% and 38.2%. These are represented by drawing horizontal lines across the chart at those price levels to define zones of market retracement before the market resumes the general trend formed by the initial large price movement. These levels can be particularly significant when a market has reached a major price support or resistance level.
The 50% retracement level is normally included in the grid of Fibonacci levels. Although it is not based on a Fibonacci number, it i+B12:B14s widely recognised as an important inflection point.
Forex Fibonacci retracements often form important support and resistance levels and can be very accurate. Experiment with Fibonacci retracement levels across different markets and time frames to find what works best for your Forex trading strategy.
We have also prepared an article that covers more strategies you can use with Forex Fibonacci retracements. You will learn how to combine Fibonacci retracements with indicators, the right time to enter the market, and how to define a trend across multiple timeframes. Please follow the link to access it: Forex strategies using Fibonacci retracements—Part 2.
Benefits of the Fibonacci retracement strategy
The main advantage of this technical analysis tool is that it is simple to build and calculate. That is why both experienced traders and beginners use it. However, these are not all the advantages of the Fibonacci retracement strategy:
- They are suitable for forming trading strategies and analysing assets, markets, and timeframes.
- Traders can easily combine Fibonacci levels with other technical analysis tools, such as candlestick patterns, moving averages, and support and resistance levels.
- The tool allows you to easily determine entry and exit points for trades, as the levels serve as reference points for corrections and reversals.
However, like any tool, Fibonacci levels have a few disadvantages, which means traders do not always manage to build an effective trading strategy, especially if they do not use additional patterns to confirm the trend. For example, Fibonacci levels cannot be built in real-time, because this requires a completed movement of the asset on an already-formed price chart.
Mistakes made by market participants can lead to inaccuracies due to shifting levels. In addition, the tool does not provide the exact moments for entry and exit, as the price does not always react to the crossing of a Fibonacci level. All of these factors are important for traders to consider when forming their strategies.
Final thoughts
- Fibonacci retracement levels are among the simplest and most popular technical analysis tools.
- The tool is based on the theory of cyclicality in trading.
- In Forex, the 61.8%, 38.2%, and 23.6% Fibonacci levels help identify the optimal points for entry and exit in trades.
- This universal tool is suitable for forming strategies in the stock market, cryptocurrency market, and Forex.
- For more accurate results, it is better to combine the Fibonacci trading strategy with other technical analysis tools.


