Confirming you are not from the U.S. or the Philippines

By giving this statement, I explicitly declare and confirm that:
  • I am not a U.S. citizen or resident
  • I am not a resident of the Philippines
  • I do not directly or indirectly own more than 10% of shares/voting rights/interest of the U.S. residents and/or do not control U.S. citizens or residents by other means
  • I am not under the direct or indirect ownership of more than 10% of shares/voting rights/interest and/or under the control of U.S. citizen or resident exercised by other means
  • I am not affiliated with U.S. citizens or residents in terms of Section 1504(a) of FATCA
  • I am aware of my liability for making a false declaration.
For the purposes of this statement, all U.S. dependent countries and territories are equalled to the main territory of the USA. I accept full responsibility for the accuracy of this declaration and commit to personally address and resolve any claims or issues that may arise from a breach of this statement.
We are dedicated to your privacy and the security of your personal information. We only collect emails to provide special offers and important information about our products and services. By submitting your email address, you agree to receive such letters from us. If you want to unsubscribe or have any questions or concerns, write to our Customer Support.
Octa trading broker
Open trading account
Back

GBP/USD Price Analysis: Needs to spend more time amid volatility contraction

  • A minor rebound in risk-off impulse has dragged the cable below 1.1300.
  • The DXY has reclaimed the critical resistance of 112.00.
  • A symmetrical triangle formation indicates a consolidation head.

The GBP/USD pair has witnessed mild selling pressure and has dropped below the critical support of 1.1300 in the early European session. A soft decline in the S&P500 futures has delivered a rebound in the risk-off profile. The US dollar index (DXY) has reclaimed the critical resistance of 112.00 and has also delivered an upside break of the morning consolidation range.

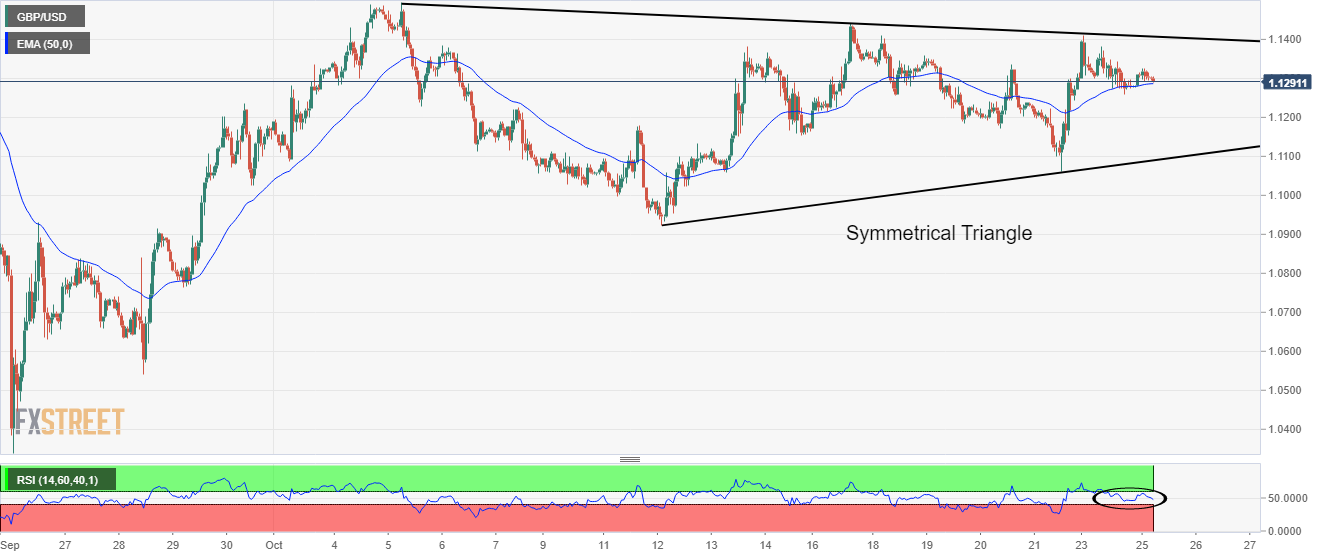
On an hourly scale, the cable is oscillating in a Symmetrical Triangle chart pattern that signals a volatility contraction. The upward-sloping trendline of the chart pattern is placed from October 12 low at 1.0924 while the downward-sloping trendline is plotted from October 5 high at 1.1496.

The 50-period Exponential Moving Average (EMA) at 1.1291 is overlapping with the asset, which indicated a rangebound structure.

Also, the Relative Strength Index (RSI) (14) is oscillating in a 40.00-60.00 range, which indicates the unavailability of a potential trigger.

Going forward, an upside break of October 17 high at 1.1440 will drive the cable towards September 14 high at 1.1590, followed by September 13 high at 1.1738.

On the flip side, a drop below Friday’s low at 1.1060 will drag the asset toward the psychological support of 1.1000. If cable surrenders the psychological support, it will expose to more downside towards October 12 low at 1.0924.

GBP/USD hourly chart


Sweden Producer Price Index (YoY) above expectations (19.9%) in September: Actual (20.6%)

Sweden Producer Price Index (YoY) above expectations (19.9%) in September: Actual (20.6%)
Read more Previous

EUR/USD: There will likely be a deadlock for now – Commerzbank

EUR/USD remains to trade below the 0.99 mark. Economists at Commerzbank note that there is a deadlock in the world's most popular currency pair. The s
Read more Next