Confirming you are not from the U.S. or the Philippines

By giving this statement, I explicitly declare and confirm that:
  • I am not a U.S. citizen or resident
  • I am not a resident of the Philippines
  • I do not directly or indirectly own more than 10% of shares/voting rights/interest of the U.S. residents and/or do not control U.S. citizens or residents by other means
  • I am not under the direct or indirect ownership of more than 10% of shares/voting rights/interest and/or under the control of U.S. citizen or resident exercised by other means
  • I am not affiliated with U.S. citizens or residents in terms of Section 1504(a) of FATCA
  • I am aware of my liability for making a false declaration.
For the purposes of this statement, all U.S. dependent countries and territories are equalled to the main territory of the USA. I accept full responsibility for the accuracy of this declaration and commit to personally address and resolve any claims or issues that may arise from a breach of this statement.
We are dedicated to your privacy and the security of your personal information. We only collect emails to provide special offers and important information about our products and services. By submitting your email address, you agree to receive such letters from us. If you want to unsubscribe or have any questions or concerns, write to our Customer Support.
Octa trading broker
Open trading account
Back

GBP/USD Price Analysis: Consolidates around 1.2750 followed by a barrier at 21-day EMA

  • GBP/USD hovers around a major level at 1.2750.
  • 21-day EMA at 1.2684 appears as an immediate support followed by the major level at 1.2650.
  • The lagging indicator MACD suggests a degree of caution among investors.

GBP/USD halts a four-day winning streak, trading lower near 1.2750 during the early European session on Tuesday. The GBP/USD pair is at a critical juncture, and the possibility of a break below the major level raises the potential for further downward pressure. The 21-day Exponential Moving Average (EMA) at 1.2684 serves as an immediate support level to monitor.

A breach below the 21-day EMA could signal increased selling pressure, and the pair might then approach the major support at 1.2650. This level, aligned with the 23.6% Fibonacci retracement at 1.2643, adds technical significance to the support zone.

The 14-day Relative Strength Index (RSI) being positioned above the 50 level is a positive sign, indicating bullish momentum for the GBP/USD pair. An RSI above 50 generally suggests that buying pressure is prevailing, and it aligns with the notion of an upward outlook for the pair.

In addition, the Moving Average Convergence Divergence (MACD) indicator also provides interesting insights. The fact that the MACD line is above the centerline is a bullish signal, suggesting potential upward momentum. However, the convergence below the signal line may indicate a degree of caution among investors.

On the upside, the GBP/USD pair could reach the previous week’s high at 1.2771. A breach above the latter could support the GBP/USD pair to explore the region around the psychological level at 1.2800 followed by December’s high at 1.2827.
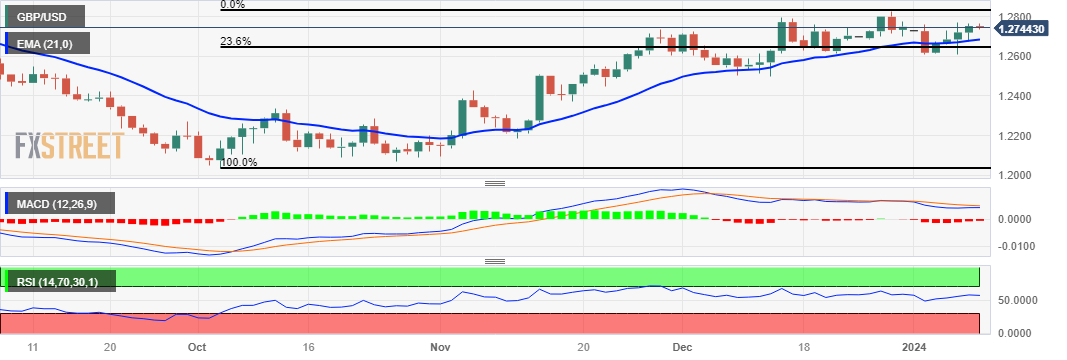
GBP/USD: Daily Chart


France Imports, EUR: €55.395B (November) vs previous €58.268B

France Imports, EUR: €55.395B (November) vs previous €58.268B
Read more Previous

EUR/USD to consolidate in a 1.08880 to 1.1020 range near term – ING

EUR/USD remains unchanged around 1.0950. Economists at ING analyze the pair’s outlook.
Read more Next