

Silver Price Forecast: XAG/USD drops near 4% weekly on strong US Dollar
- XAG/USD slips to $31.13, with downside risks growing
- Silver fails to hold above $33.00, triggering consolidation and selling pressure.
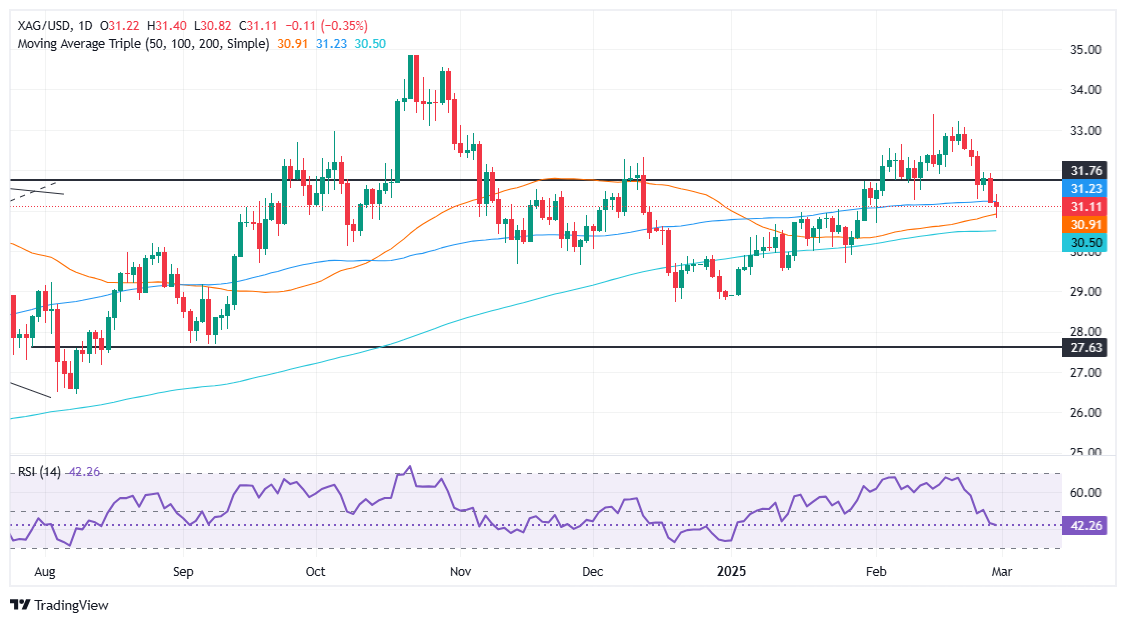
- Price tests 100-day SMA at $31.20; next key support at 50-day SMA of $30.89.
- Break below $30.89 could expose 200-day SMA at $30.47 and January low of $29.70.
Silver ended the week on a lower note, down almost 4%, as traders booked profits amid US recession jitters following the release of crucial US data. At the time of writing, the XAG/USD trades at $31.13, down 0.32%.
XAG/USD Price Forecast: Technical outlook
The grey metal had shown signs of consolidation after failing to decisively clear the $33.00 on a daily closing basis, which could’ve exacerbated a rally towards the $34.00 figure. Instead, XAG/USD spot price cleared the 100-day Simple Moving Average (SMA) at $31.20, opening the door to test the 50-day SMA at $30.89.
Although bears pushed prices lower, buyers reclaimed $31.00. Nevertheless, the Relative Strength Index (RSI) shows sellers are gathering momentum.
Therefore, XAG/USD's first support would be the 50-day SMA at $30.89 on further weakness. A breach of the latter will expose the 200-day SMA at $30.47. If sellers conquer those two levels, the trend shifts downwards, and bears would be poised to challenge the January 27 daily through at $29.70.
XAG/USD Price Chart – Daily
Silver FAQs
Silver is a precious metal highly traded among investors. It has been historically used as a store of value and a medium of exchange. Although less popular than Gold, traders may turn to Silver to diversify their investment portfolio, for its intrinsic value or as a potential hedge during high-inflation periods. Investors can buy physical Silver, in coins or in bars, or trade it through vehicles such as Exchange Traded Funds, which track its price on international markets.
Silver prices can move due to a wide range of factors. Geopolitical instability or fears of a deep recession can make Silver price escalate due to its safe-haven status, although to a lesser extent than Gold's. As a yieldless asset, Silver tends to rise with lower interest rates. Its moves also depend on how the US Dollar (USD) behaves as the asset is priced in dollars (XAG/USD). A strong Dollar tends to keep the price of Silver at bay, whereas a weaker Dollar is likely to propel prices up. Other factors such as investment demand, mining supply – Silver is much more abundant than Gold – and recycling rates can also affect prices.
Silver is widely used in industry, particularly in sectors such as electronics or solar energy, as it has one of the highest electric conductivity of all metals – more than Copper and Gold. A surge in demand can increase prices, while a decline tends to lower them. Dynamics in the US, Chinese and Indian economies can also contribute to price swings: for the US and particularly China, their big industrial sectors use Silver in various processes; in India, consumers’ demand for the precious metal for jewellery also plays a key role in setting prices.
Silver prices tend to follow Gold's moves. When Gold prices rise, Silver typically follows suit, as their status as safe-haven assets is similar. The Gold/Silver ratio, which shows the number of ounces of Silver needed to equal the value of one ounce of Gold, may help to determine the relative valuation between both metals. Some investors may consider a high ratio as an indicator that Silver is undervalued, or Gold is overvalued. On the contrary, a low ratio might suggest that Gold is undervalued relative to Silver.