Confirming you are not from the U.S. or the Philippines

By giving this statement, I explicitly declare and confirm that:
  • I am not a U.S. citizen or resident
  • I am not a resident of the Philippines
  • I do not directly or indirectly own more than 10% of shares/voting rights/interest of the U.S. residents and/or do not control U.S. citizens or residents by other means
  • I am not under the direct or indirect ownership of more than 10% of shares/voting rights/interest and/or under the control of U.S. citizen or resident exercised by other means
  • I am not affiliated with U.S. citizens or residents in terms of Section 1504(a) of FATCA
  • I am aware of my liability for making a false declaration.
For the purposes of this statement, all U.S. dependent countries and territories are equalled to the main territory of the USA. I accept full responsibility for the accuracy of this declaration and commit to personally address and resolve any claims or issues that may arise from a breach of this statement.
We are dedicated to your privacy and the security of your personal information. We only collect emails to provide special offers and important information about our products and services. By submitting your email address, you agree to receive such letters from us. If you want to unsubscribe or have any questions or concerns, write to our Customer Support.
Octa trading broker
Open trading account
Back

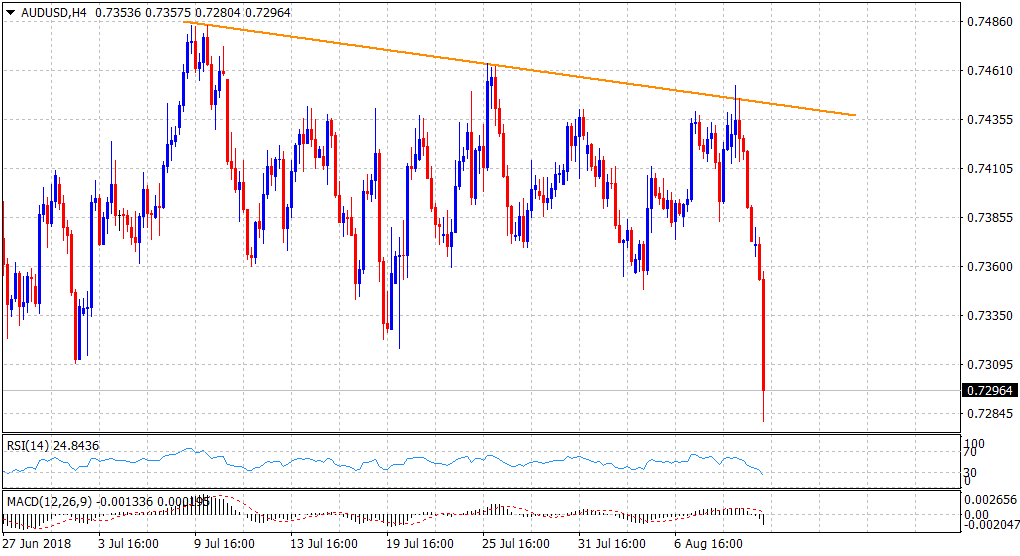
AUD/USD Technical Analysis: Tumbles to 20-month lows, below 0.7300 mark

   •  The pair extended overnight rejection slide from a one-month-old descending trend-line hurdle, also coinciding with 55-day SMA and tumbled to 20-month lows.

   •  Weakness below the 0.7300 handle now seems to have confirmed a bearish breakdown below an eight-week-old broader trading range. 

   •  Technical indicators on daily charts are still far from near-term oversold conditions and thus, increase the pair's vulnerability to continue with its downward trajectory.

AUD/USD 4-hourly chart
Spot Rate: 
Daily High: 0.7380
Trend: Bearish

Resistance
R1: 0.7310 (previous YTD low set on July 2)
R2: 0.7355 (horizontal zone)
R3: 0.7380 (daily swing high)

Support
S1: 0.7280 (horizontal zone)
S2: 0.7259 (S3 daily pivot-point)
S3: 0.7200 (round figure mark)
 

GBP/USD Technical Analysis: 12-month lows seeing little rebound

GBP/USD Chart, 15-Minute Spot rate:  1.2806 Relative change:  -0.14% High:  1.2836 Low:  1.2796
Read more Previous

US: YoY rate for core CPI inflation likely to be 2.32% - Deutsche Bank

According to analysts at Deutsche Bank, the main highlight today is US CPI and analysts at DB expects core inflation (0.23% month-over-month) to rebou
Read more Next