Confirming you are not from the U.S. or the Philippines

By giving this statement, I explicitly declare and confirm that:
  • I am not a U.S. citizen or resident
  • I am not a resident of the Philippines
  • I do not directly or indirectly own more than 10% of shares/voting rights/interest of the U.S. residents and/or do not control U.S. citizens or residents by other means
  • I am not under the direct or indirect ownership of more than 10% of shares/voting rights/interest and/or under the control of U.S. citizen or resident exercised by other means
  • I am not affiliated with U.S. citizens or residents in terms of Section 1504(a) of FATCA
  • I am aware of my liability for making a false declaration.
For the purposes of this statement, all U.S. dependent countries and territories are equalled to the main territory of the USA. I accept full responsibility for the accuracy of this declaration and commit to personally address and resolve any claims or issues that may arise from a breach of this statement.
We are dedicated to your privacy and the security of your personal information. We only collect emails to provide special offers and important information about our products and services. By submitting your email address, you agree to receive such letters from us. If you want to unsubscribe or have any questions or concerns, write to our Customer Support.
Octa trading broker
Open trading account
Back

USD/CAD technical analysis: On the back foot below 12-week-old rising trendline

  • USD/CAD remains under pressure below key support-turned-resistance.
  • The 23.6% Fibonacci retracement, September low become likely nearby supports to watch.

Following its downside break of near-term key support line, USD/CAD declines to 1.3197during early Asian session on Monday.

The pair now aims to visit 23.6% Fibonacci retracement level of May-July south-run, at 1.3145 whereas September month low close to 1.3130 could please sellers afterward.

It should, however, be noted that the 14-bar Relative Strength Index (RSI) might drop to oversold territory during further declines and could lure counter-trend traders around 1.3130.

On the contrary, pair’s daily closing beyond support-turned-resistance, at 1.3215 now, can trigger fresh pullback to 100-day Simple Moving Average (SMA) level near 1.3240.

However, 50% Fibonacci retracement and 200-day SMA becomes a tough barrier around 1.3285/90 for buyers to confront, which if broken could escalate the recovery to monthly tops surrounding 1.3350.

USD/CAD daily chart
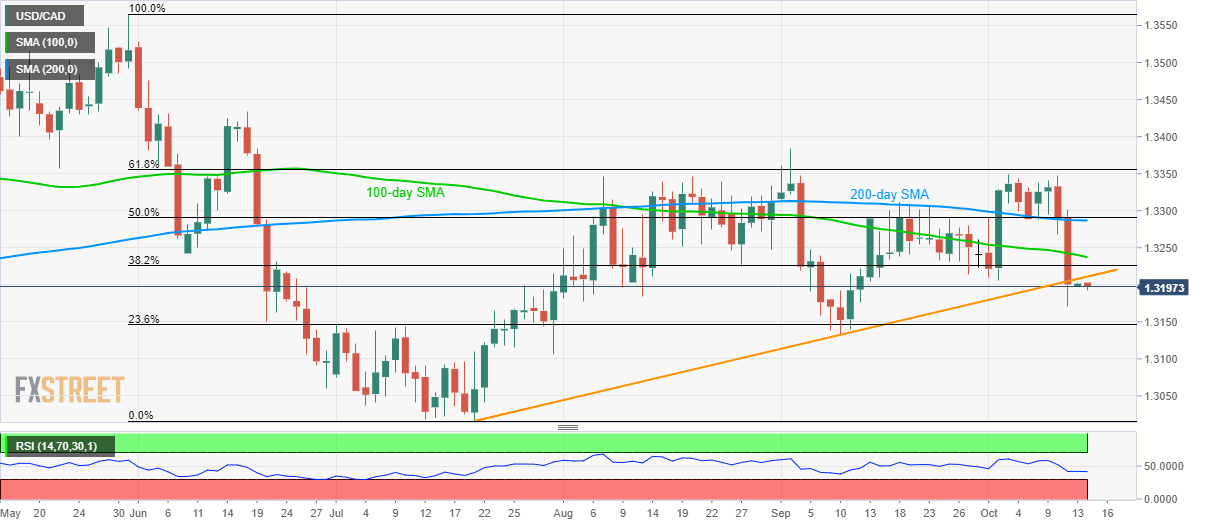
Trend: bearish


EUR/JPY technical analysis: Momentum stalling below of trendline support

Overcoming the 6-month downtrend at 118.77 and rising from 116.58/115.87 recent lows, EUR/JPY rallied to the September highs which meet the July lows,
Read more Previous

WTI bulls eye a run towards the 200-DMA

West Texas Intermediate crude prices are firm in the open having penetrated the 21-day moving average following a solid performance at the endo f last
Read more Next