USD/CAD Price Analysis: Refreshes four-week high, multiple key resistances ahead
- USD/CAD extends the BOC-led gains to the highest since Christmas-day.
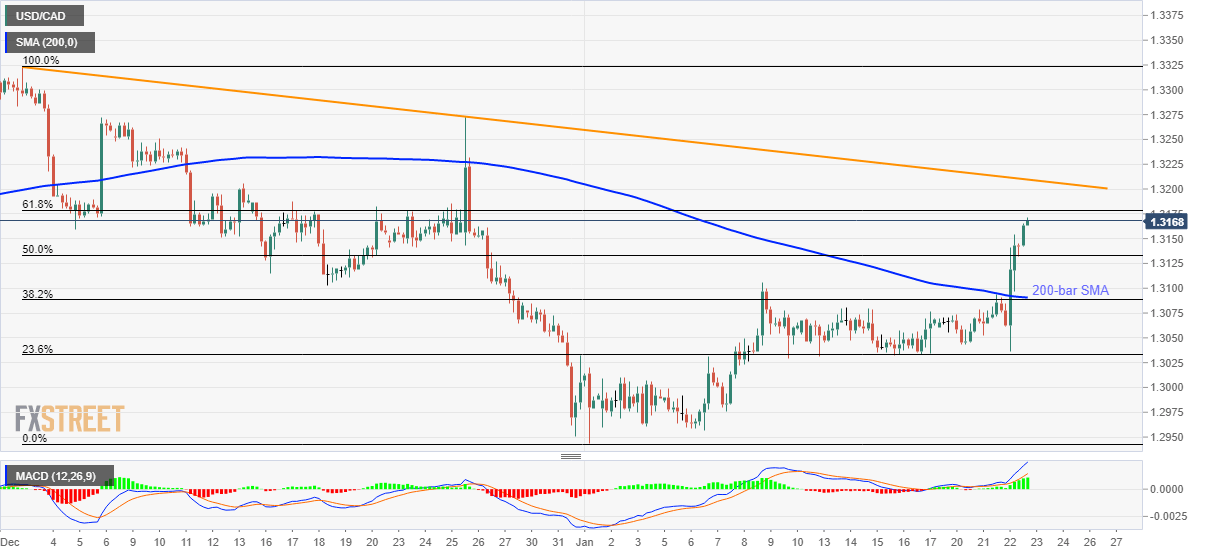
- 61.8% Fibonacci retracement, the seven-week-old falling trend line will challenge further upside.
- 200-bar SMA, 38.2% Fibonacci retracement act as the key support.
USD/CAD takes the bids to 1.3168, following the high of 1.3171, while heading into the European session on Thursday.
While bullish MACD and a sustained break of 200-bar SMA signal further upside for the pair, 61.8% Fibonacci retracement level of its fall between December 2019 and January 2020 at 1.3180 offers the near-term key upside barrier.
In a case where prices manage to clear 1.3180, a multi-week-old falling trend line near 1.3210 will be important as the break of which will propel the USD/CAD prices towards December 25 high of 1.3273.
On the contrary, the 50% Fibonacci retracement level of 1.3133 will become immediate support during the pair’s pullback. However, a confluence of 38.2% Fibonacci retracement and 200-bar SMA close to 1.3090 could restrict the pair’s further downside.
If at all the bears dominate below 1.3090, 23.6% Fibonacci retracement near 1.3030 and 1.3000 round-figure will be their favorite.
USD/CAD four-hour chart
Trend: Pullback expected